Data Sonograms
Data Sonograms are motivated by the analogy of seismic exploration. An
"explosion" is done in data space and the echo signal is the sonification.
In this model, the data points are fixed with a spring to their position
in the euclidien data space. Thus each point is able to perform vibrational
movements around its equibrilium position. The system is now excited by
a shock wave which is emanating from a certain position which is selected
by the user. This shock wave expands spherically through data space, exciting
all data points when they are reached. Selected points contribute to the
sonification, which is a superposition of their vibrational motion.
System dynamics
The dynamics of that system is determined by well known laws of motion,
assuming constant spring stiffness, fixed mass for each data point and
a friction force that is proportional to the particle velocity. To get
a richer sonification, the oscillators attributes can be driven by data
properties or features of the local data point environment, e.g. the local
data density or the class entropy may be related to the stiffness of the
spring, or the friction forces may be related to the class membership of
data points.
Excitation of the data
Excitation occurs by defining a shock wave origin. This can be done by
selecting a group of points in a 3d plot. The selected position then is
their center of mass. Thus, for labeled data the origin can easily be selected
to be the
class average or the average of the whole data set. Additionally, apart
from real physics, it can be chosen a decay characteristics of the shock
wave, either proportional to 1/r^2, 1/r^dim or const.
Selection of audible data
Via the GUI, a selection of points which contribute to the acoustic signal,
can be made. As an example, when analysing labeled data of a classification
problem, the distribution of each class can be sonified and be listened
to separately.
Listening Space
Our auditory system is rather good in estimating spatial information from
an listening event. To use this perception feature, the best would be a
multi-speaker system. However, even with headphones, some localization
cues can be given using ILD/ITD (interaural level/time difference). This
is done in this sonification the following way: the listener is assumed
to be positioned at the shock wave center, his ears oriented along the
first principal component of the selected data, looking into the direction
of the second principal component.
What can be perceived ?
First of all, the spherical distribution of tones is perceived. Derivations
from a gaussian distribution (e.g. multiple modes) can be perceived. The
sonification especially highlights outliers and, depending on selection
of the setup, their relation to other classes (if labeled data is analyzed).
A clustering of the data as well as regularities of the data can be perceived.
An interesting sonification comes out, if the class entropy S, which
is a measure of unorder in the distribution among the k nearest neighbours
of a data point is taken as the spring stiffness. Then, classes that are
completely separated from others are easily perceived. This may give cues
for the propable performance of classifiers or the choice of a data model.
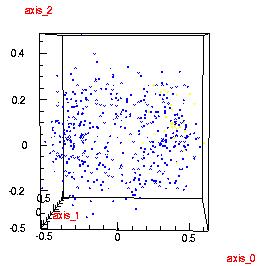
Some Data Sonograms
A ring structure (plus noise) in 20 dimensional data space. Here the spring
stiffness is density driven.
The shock wave is excited at a edge of the data set. The structure
gets almost lost in most plot axis selections.
Here some data sonifications:
-
ring data sonification
The ring structure is perceived by a spatial broadening and reconnecing.
For reference purposes, acoustic tickmarks are underlied.
-
ring data with spatial fading
Here the shock wave looses energy with 1/r**2. In a d dimensional data
space, r**(-d+1) would be more correct, but than loudness drop is too fast
in high dimensional data.
-
ring
data with data driven friction
Here, additionally the friction force is driven by the 3rd axis values.
You perceive, that these values have some monotone variation over the data.
Generally, you remark, that the higher the data space dimensionality
is, the later the tones start. That is known as the
emptiness of high dimensional spaces. The average distance of random
points peaks at a non-zero value.
This can easily be perceived in data sonograms.
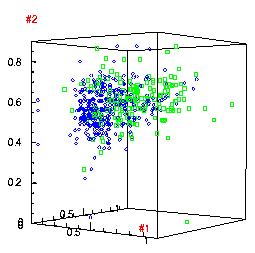
Data of an Classification problem: Diagnose diabetes of Pima indians
A 8 dimensional input (number of times being pregnant, plasmaglucose
concentration, diastolic blood presure, etc)
and a binary diagnosis result is given. The plot shows the first 3
columns. The data sonogram states
Here are some sonifications:
The following two sonifications are rendered from the well known IRIS data
set benchmark. The separability of class 0 can be easily perceived, the
overlap between class 1 and class 2 as well.
-
iris data - class 0 - class 1
-
iris data - class 1 - class 2
Discussion
Inspecting the data visually, you have to take a look on all axis-triple
combinations to get an overall imagination of distance relations. This
is not practicable with high dimensional data sets. Here data sonograms
give qualitative information fast and intuitively. The usage of the display
must be learned. Some usable standard setups should be accessable fastly,
better spatialization with a multi-speaker array would improve the usage
further.
Contact: Thomas Hermann: thermann@techfak.uni-bielefeld.de
Back
to Sonification Page
Last modified: Tue 07-14-1999