
- Thomas Hermann, Peter Meinicke, Helge Ritter (2000)
In Cook, P. R. (Ed.) Proceedings of the International Conference on Auditory Display, p. 81--86, ICAD, International Community for Auditory Display (ICAD)
[BibTeX Entry]
[Download PDF]
Summary
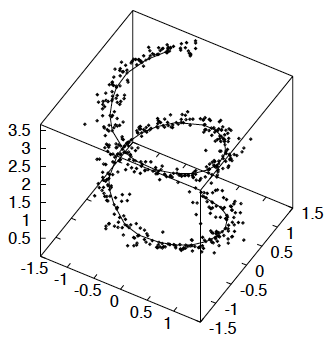 Abb.: The Figure depicts a principal curve trained into a noisy spiral with variance modulation. A user study showed that users can significantly better understand the structure by combined audiovisual analysis than by using visual display alone.
This paper describes a new approach to render sonifications for high-dimensional data, allowing the user to perceive the ``main'' structure of the data distribution. This is achieved by computing the principal curve of the data set, which is a trajectory that passes through the ``middle'' of the data and allows to define a time order on the data points. The sonification can be imagined as the time-variant auditory scene, perceived while moving along the principal curve. In this paper a method for computing principal curves is presented, the sonification concept is introduced and some sonification examples are given.
- Example 1, 2: Principal Curve Sonification for the noisy spiral data set
- Example 3: Principal Curve Sonification for the 9d tetrahedron data set
- Example 4: Principal Curve Sonification for the Iris data set
Contact
Thomas Hermann
Helge Ritter
Principal Curve Sonification
Media files
Noisy Spiral Data Set Sonification: WAVE-File
Noisy Spiral with variance modulation structure: WAVE-File
This data set contains 10 clusters which are easily depicted from the sonification: WAVE-File
class attribute determines tick pitch: WAVE-File